Economic Affairs, Vol. 64, No. 4, pp. 783-787, December 2019
DOI: 10.30954/0424-2513.4.2019.13
©2019 EA. All rights reserved
Growth Performance of Livestock Population in India, Karnataka and North-Eastern Region of Karnataka
Yasmeen*1, Suresh S. Patil2, Hiremath, G.M3., Jagjiwan Ram4 and Koppalkar, B.G.5
1Research Consultant, Institute for Social and Economic Change (ISEC), Nagarabhavi, Bengaluru, India
2Dean (Agri.), College of Agriculture, Kalaburagi, University of Agricultural Science, Raichur, India
3Department of Agricultural Economics, University of Agricultural Science, Raichur, India
4Department of Animal Science, University of Agricultural Science, Raichur, India
5Department of Agronomy, University of Agricultural Science, Raichur, India
*Corresponding author: itsmeyas786@gmail.com (ORCID ID: 0000-0002-5685-2152)
Received: 16-06-2019
Revised: 19-10-2019
Accepted: 29-11-2019
ABSTRACT
Livestock sector plays a prominent role in rural economy for supplementing the income of rural households particularly for landless labourers, small and marginal farmers. The study was conducted to understand the growth and trends of livestock population in India, Karnataka and North-eastern Karnataka. The secondary data pertained to livestock population was collected from various sources. The study revealed that, In India, the growth in total livestock during 1982-2012 indicated that it had grown at an annual growth rate (AGR) of 0.69 per cent. Among livestock, cattle registered an AGR of 0.21 per cent, while buffalo, sheep and goat registered an AGR of 2.31, 1.95 and 1.31 per cent respectively. Whereas in Karnataka, the growth in total livestock was reported at an AGR of 1.13 per cent during 1982-2012. The growth in total livestock of North-Eastern Karnataka (1982-2012) showed with an AGR of 1.68 per cent. Whereas, cattle population growth rate was registered with a negative AGR of -0.21 per cent, but buffalo, sheep and goat registered an AGR of 1.95, 4.35 and 2.17 per cent respectively.
Highlights
 The main reason for declining in livestock population was the severe droughts which had been occurred in the study area.
Keywords: Livestock, growth, population, livelihood, percentage growth rate
Livestock production is the backbone of Indian agriculture and source of employment in rural areas since centuries, in which the entire system of rural economy has revolved around it. Since decades, the livestock keeping was emerged as an integral part of Indian farming with evidence in the oldest Indian scriptures, such as the Atharvaveda, Ayurveda and Rigveda and in archaeological remains of Harappan era in the Indus civilization (about 2000 B.C.), including a coin bearing the figure of a bull and terracotta bullock carts (Narang, 2002).
Livestock was revealed with multi-faceted contribution to socio-economic development of rural masses. Due to the inelastic absorptive capacity for labour in other economic sectors, livestock sector has greater scope for generating more employment opportunities, especially for the marginal and small farmers and landless labourers who own around 70 per cent of the country’s livestock. On the other hand, livestock wealth was more equitably distributed than that of land (Anjani Kumar and Singh, 2011). Being an important source of income and employment, the livestock also helps in alleviating poverty and smoothening of income distribution (Birthal et at.2012).
How to cite this article:Yasmeen, Patil, S.S., Hiremath, G.M., Ram, J. and Koppalkar, B.G. (2019). Growth performance of livestock population in India, Karnataka and north-eastern region of Karnataka. Economic Affairs,64(4): 783-787.
Globally, the livestock wealth comprises of 298.2 million of buffaloes, 995.7 million of cattle, 1520.6 million of goats, 2605.2 million of sheep, 128.5 million of horses, 108.5 million of donkeys and 93.9 million of camels (FAOSTAT, 2016). The distribution of livestock population across the globe showed that ruminants, cattle and sheep dominated in Asia, Africa and Oceania, while the proportion of cattle, sheep and goat population was almost same in Europe. In North, Central and South America, population of cattle dominated, while goats are primarily found in Asia (51%) and Africa (41%). Asia accounts for 46 per cent of sheep and 62 per cent of swine population. About 95.65 per cent of world’s total livestock population was found in Asia whereas 78 per cent of camel population was in Africa (Rae et al.2017).
India supports approximately 22 per cent of world’s human and 16 per cent of livestock population on 2.9 per cent of its geographical area, where livestock has emerged as a driving force in the growth of agricultural sector. Further, this sector accounts for a GDP of 2681 billion contributing 4.87 per cent to the total GDP, while 21.84 per cent to the agricultural GDP (CSO, 2017). However, the growth rate of total GDP during 2015-16 was 2.1 per cent and 3.9 per cent in terms of value of output for livestock sector. Besides, the sector contributed 239.16 million tons of milk, 71.52 billion of eggs, 36.41 million kg of wool and 6.83 million tons of meat respectively (GOI, 2017). During 2016-17, the proportion of milk, egg, meat and wool were recorded with growth rate of 6.0, 5.9, 16.8 and 6.2 per cent respectively. In addition, the growth of livestock sector was observed at annual rate of 5.3 per cent during 1980s, 3.9 per cent during 1990s and 3.7 per cent during 2000s respectively. Despite deceleration, growth of the sector was remained about 2.1 per cent larger than the crop sector which revealed that the growth of sector had found critical role in cushioning the agricultural growth (Sreenivasa and Ramappa, 2016).
Furthermore, India possesses the largest livestock population (over 620 million) in the world, where the biggest flock of cattle and buffaloes recorded 21 per cent and 62.4 per cent of the world population respectively. Among them, second largest flock of goats with 17.4 per cent followed by sheep with 6.2 per cent (GOI, 2017). The growth rates in cattle, buffaloes, sheep, goats, horses and ponies, camels, pigs, mules, donkeys and yaks population in the inter-censual period 2007-12 were 1.48, 1.12, -1.40, -1.31, -2.98, -3.24, -2.51, -1.76, -5.64, and 5.14 per cent respectively (Dubey et al.2015).
In Karnataka, agriculture and allied sector contributes about 32 per cent to the state GDP occupying a significant portion in state’s economy. It has a strong welfare dimensions, as it provides income to the rural households, with stable and dependable. The contribution of livestock sector to the state’s GDP is 9.12 per cent. According to the 19th livestock census (2012), the livestock population in Karnataka was 9.51 million of cattle, 3.47 million of buffaloes, 9.58 million of sheep, 4.79 million of goats, 1.21 million of pigs and 32 million of poultry respectively. The dominant species of livestock in the state includes buffalo, cattle, goat, sheep and poultry (GOK, 2017). The state ranks 17thin total livestock population and 14th in poultry population in India. Besides, it contributes roughly 2.89 per cent of total livestock population and 3.51 per cent of poultry population in the country (GOI, 2017). There is a definite relationship between crop sector and livestock sector established through input-output linkages with a significant bearing on sustainability of land use (Hegde, 2016).
In NEK region, according to livestock census 2012, the number of total livestock were increased from 4.89 million in 1982 to 6.59 million in 2012. Among livestock, the cattle population was 2.01 million, 0.79 million of buffaloes, 2.23 million of sheep and 1.56 million of goats respectively. In the region ownership of the livestock was unevenly distributed and considerable regional diversity was observed in livestock productivity as well as in stocking rates of species. Thus, the region was revealed that the livestock rearing has all along been an indispensable, complementary activity to agriculture.
MATERIALS AND METHODS
The data pertaining to livestock population over the years were collected from livestock census for past 30 years. The Department of Animal Husbandry, Dairying and fisheries, Ministry of Agriculture and Farmers Welfare, Government of India, Indiastat. com website, various publications of Department of Animal Husbandry and Fisheries, Government of Karnataka etc. were reviewed to collect the relevant data pertaining to livestock.
The livestock population data were collected for 30 years i.e.,from 1982 to 2012 from various websites based on the livestock census, as the study region was North-Eastern Karnataka and the livestock census data pertaining to the study region was available from 1982. Hence this was the reason for the selection of data from the year 1982. The different periods which have been used in the research are given below:
Period I - 1982-1987, Period II - 1987-1992, Period III - 1992-1997, Period IV - 1997-2003, Period V - 2003-2007, Period VI - 2007-2012
Analytical tools
The analytical tool used for assessing the objective of the study is,
Annual Growth Rates
The percent change from one period to another is calculated from the formula:
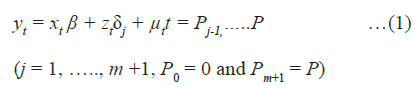
Where,
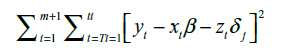
The annual percentage growth rate is simply the per cent growth divided by N, the number of years.
RESULTS AND DISCUSSION
Status of livestock population in India
Livestock population data were collected from 1982 to 2012 from the Department of Animal Husbandry, Dairying & Fisheries, Ministry of Agriculture and Farmers Welfare. Government of India. The status and growth rate of livestock population data in India is given in Table 1. The number of total livestock increased from 406.24 million in 1982 to 499.84 million in 2012 giving an overall growth rate (AGR) of 0.69 per cent. Within the livestock, cattle population increased from 192.45 million in 1982 to 190.90 million in 2012 indicating an AGR of 0.21 per cent, the buffaloes population increased from 69.78 million in 1982 to 108.70 million in 2012 registered AGR of 2.31 per cent, the sheep population had increased from 48.76 million in 1982 to 65.07 million in 2012 indicating an AGR of 1.95 per cent and goat population was increased from 95.25 million in 1982 to 135.17 million in 2012 indicating an AGR of 1.31 per cent respectively. The results are in conformity with findings of other investigations (Sharma, 2004), who reported that the population of non-productive bovine (indigenous cattle and male cattle) had declined, whereas that of productive animal like crossbred cow had increased.
Status of livestock population in Karnataka
The status and growth rate of livestock population in Karnataka is given in Table 2. The number of total livestock increased from 24.28 million in 1982 to 27.35 million in 2012 with an AGR of 1.13 per cent. Within the livestock, the cattle population reduced from 11.30 million in 1982 to 9.51 million in 2012 with a negative AGR of 0.38 per cent. The buffalos population decreased from 3.64 million in 1982 to 3.47 million in 2012 and registered AGR of 0.96 per cent, sheep population increased from 4.79 million in 1982 to 9.58 million in 2012 indicating an AGR of 3.58 per cent while goat population increased from 4.54 million in 1982 to 4.79 million in 2012 with an AGR of 1.51 per cent. As per the period 2001-2004, it was reported that the severe droughts had been occurred in Karnataka, hence the livestock population was decreased. Nagaratna and shridhar (2010) also revealed that the annual income of the households had reduced to half in drought year as per the study about consequences of drought with reference to livestock and fodder during 2003 in Karnataka. Further, the reduction was more in case of crops (61.42%) followed by livestock (30%) and labour (20%). During drought year, 17.34 per cent of households adopted for distress selling of livestock, while the average herd size was reduced from 4.15 to 3.85 adult cattle unit. Whereas, majority of the livestock holder (70.84 %) had purchased fodder to mitigate drought effect, while 32.10 per cent of them fed less to the livestock than the usual quantity.
Table 1: Status and growth of livestock population in India (1982-2012)

Source: Department of Animal Husbandry, Dairying & Fisheries, Min. of Agri. & Farmers Welf. GoI
Table 2: Status and growth of livestock population in Karnataka (1982-2012)
Source: Department of Animal Husbandry & Fisheries, GoK
Table 3: Status and growth of livestock population in North-Eastern Karnataka (1982-2012)
Source: Department of Animal Husbandry & Fisheries, GoK.
Status of livestock population in North-Eastern Karnataka
The status and growth rate of livestock population in North-Eastern Karnataka covering six districts is given in Table 3. The population of total livestock increased from 4.89 million in 1982 to 6.59 million in 2012 reported an AGR of 1.68 per cent. Within the livestock, cattle population reduced from 2.25 million in 1982 to 2.01 million in 2012 restricting a negative AGR of 0.21 per cent. The buffalos population increased from 0.62 million in 1982 to 0.79 million in 2007 registered AGR of 1.95 per cent, while the sheep population increased from 0.96 million in 1982 to 2.23 million in 2012 with an AGR of 4.35 per cent, similarly the goat population increased from 1.05 million in 1982 to 1.56 million in 2012 with an AGR of 2.17 per cent respectively. During the period 2001-2004, the decreased livestock population was reported due to severe drought. Thus, the indigenous cattle population was declined due to the use of tractor operated machinery which may render some of the draft cattle population surplus. The studies under AICRP on energy requirement was indicated that the tractor owning farms do use the draft animals for certain jobs. Therefore, the farmers were not interested to maintain draft cattle due to higher maintenance cost.
CONCLUSION
Livestock sector plays an important role in rural and Indian economy, particularly for supplementing the income of rural households, landless labourers, small and marginal farmers. Further, it helps in augmenting the farm family income, narrowing down the protein gap, providing draught power and manure for crop cultivation as well as in earning foreign exchange. Being an important source of income and employment, the sector also helps in alleviating poverty and smoothening of income distribution. About 20.5 million people depend upon livestock for their livelihood. Livestock contributed 16 per cent to the income of small farm households as against an average of 14 per cent for all rural households. Livestock provides livelihood to two-third of rural community. It also provides employment to about 8.8 per cent of the population in India. India has vast livestock resources. Livestock sector contributes 4.11 per cent GDP and 25.6 per cent of total Agriculture GDP.
ACKNOWLEDGMENTS
This research paper was authors doctoral research work. We thank our professors from University of Agricultural Sciences (UAS), Raichur. India, who provided insight, guidance and expertise that greatly assisted the research.
REFERENCES
Anjani Kumar. and Singh, D.K. 2011. Livestock production system in India determinants of livestock rearing. Ind. J. Agric. Econ.,59(4): 79-83.
Birthal, P.S., Joshi, P.K. and Birthal, Kumar, 2012. Assessment of research priorities for livestock sector in India. Policy paper 15, National Centre for Agricultural Economics and Policy Research (ICAR), New Delhi.
CSO (Central Statistical Organization), 2017. National Account Statistics. Ministry of Statistics and Programme Implementation (MOSPI), Government of India, New Delhi, pp. 134-139.
Dubey, C.N., Singh, S. and Rai, V.N. 2015. Trend and growth pattern in livestock population of Uttar Pradesh. In- International Conference of Managing Sustainable Development of Rural Economy and Agri Business (ICON BHU 15), Banaras Hindu University Varanasi, India.
FAO STAT (Food and Agricultural Organization Statistics), 2016. Statistical database: http://www.faostat.org.
GOI (Government if India), 2017. Economic Survey 2015-16. Economic Division, Ministry of Finance, New Delhi.
GOK (Government of Karnataka), 2017. Statistical Abstract of Karnataka - Directorate of Economics and Statistics, Bengaluru, Karnataka.
Hegde, N.G. 2016. Souvenir of the 39th Annual General Meeting and 48th National Symposium on “Energizing rural India-A challenge to livestock industry.” Compound Livestock Feed Manufactures Association of India (CLFMA), Manesar, Haryana, pp. 50-63.
Nagaratna, B. and Shridar, K. 2010. Consequences of 2003 Drought in Karnataka with particular reference to livestock and fodder./. Human Ecol.J. 26(2): 123-130.
Narang, I.K. 2002. Our scriptures on cow milk. Ind. Dairyman, 54: 9-11.
Rae, A., Nayga, R., Philipson, J. and Zonabend, E. 2017. Global perspectives on animal genetic resources for sustainable agriculture and food production in the tropics in animal genetics training resource. International Livestock Research Institute, Swedish University of Agricultural Sciences, Uppsala, Sweden.
Sharma, V. P. 2004. Livestock economy of India: current status and emerging issues and long-term prospects. Ind. J. Agric. Econ., 59(3): 512-554.
Sreenivasa Reddy, B. and Ramappa, P. 2016. Performance of livestock sector in India (With Reference to Bovine Population).Cur. Agric. Res. J., 4(1): 36-42.
www.indiastat.com